shakshuka with beef + 1 egg. Ingredients
robovac
Alien 3
* * *
Many Windows versions ago, somebody made a little utility called Color Cop. It let you mouse to any pixel on the desktop, "pick" the color under the pointer (analogous to the eyedropper tool in image editing software like GIMP or P'Shop), and reported the corresponding color code in hex, RGB and maybe other formats. Invaluable for color-matching between projects, platforms and image formats.
Eventually Windows evolution left Color Cop kind of glitchy, but meanwhile the MS Power Toys group embedded a work-alike tool. The problem with that is you have to run Power Toys and then invoke that picker tool from within the cluttered PToys UI, or via keyboard shortcut. There's no way to make a desktop icon that invokes only that tool, and then Power Toys wants to as a constant-on service at start, taking up somthing like 300+MB of system RAM. That's not a lot in current mid-tier computers packing 32~64GB, but I'm a fan of generally not occupying RAM unnecessarily.
BUT! There is a 3rd-party free stand-alone executable, "Just Color Picker" (jcpicker). RIP, Color Cop.
* * *
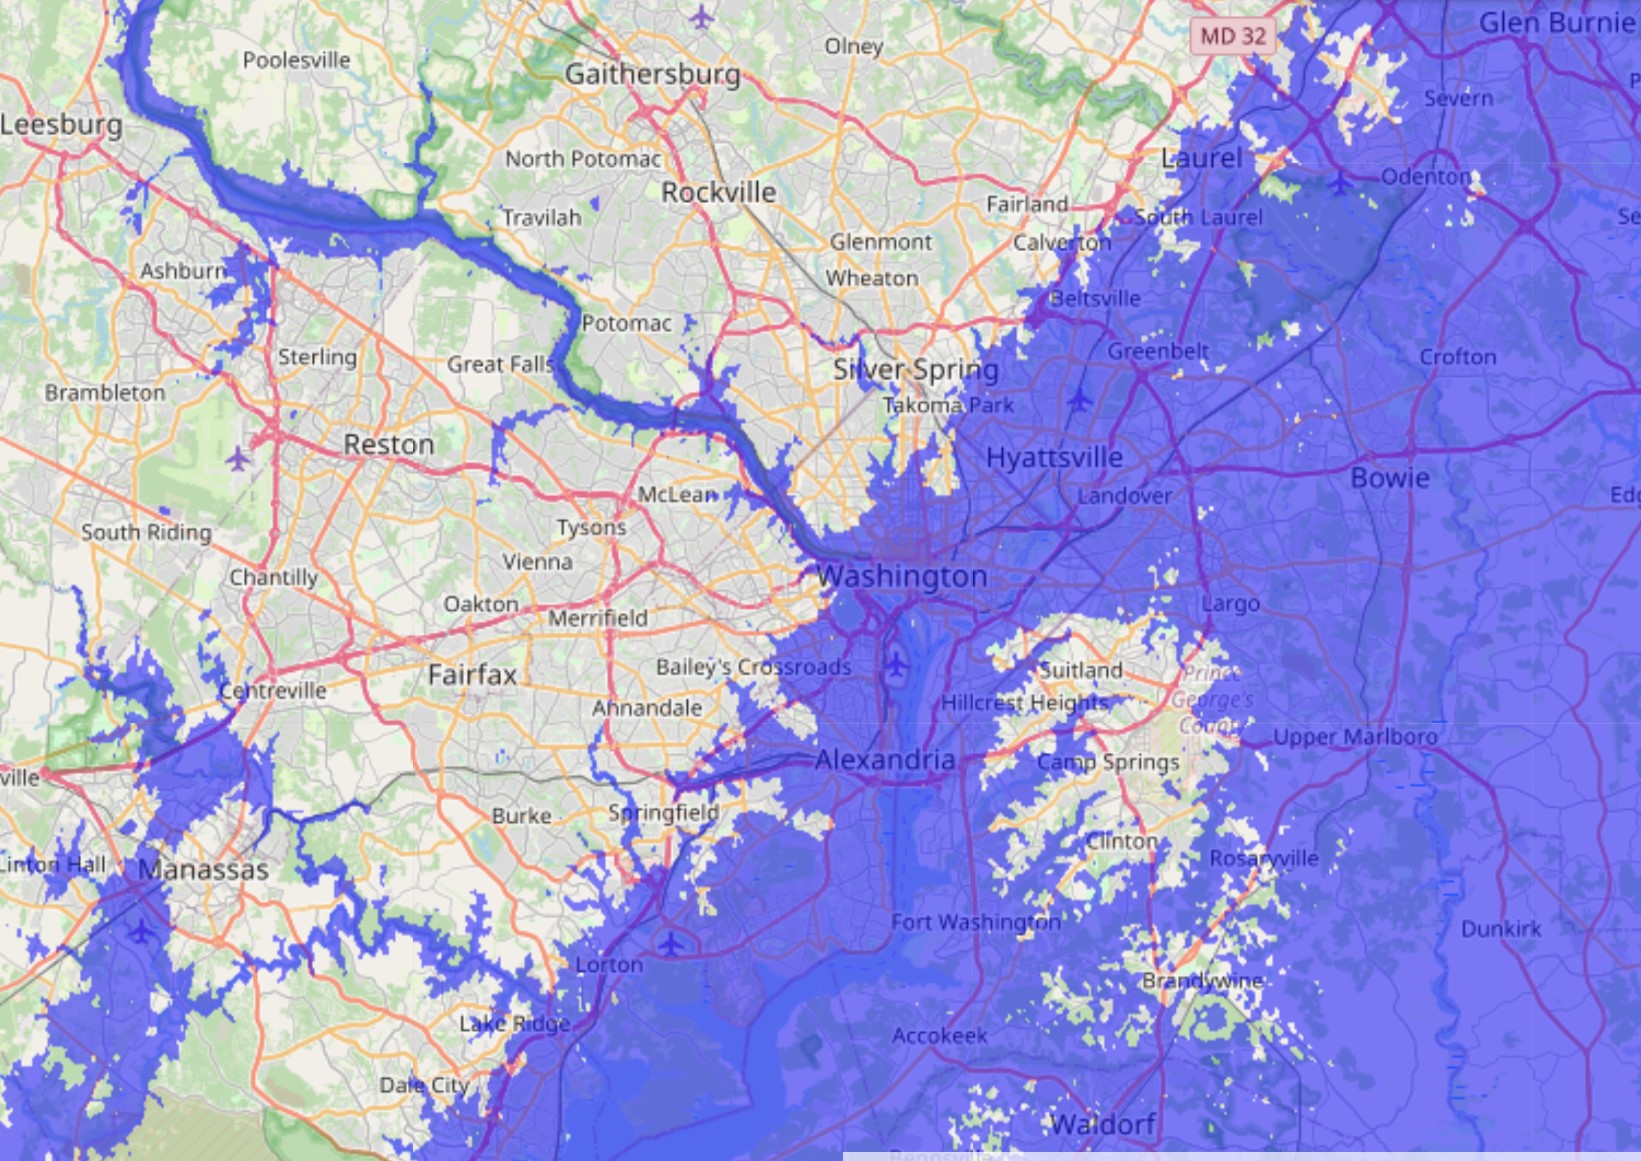
Revisiting maps of a global ice-melt milieu, since the lizard people evidently DGAF, even banking on it:
- FloodMap.net defaults to 400m. Max realistic sea level rise is actually more like ~70m (230 ft)
- 70m rise puts most of the District underwater, maybe 80-85%.
National Mall, Georgetown, Pentagon, Reagan airport, most of Arlington / Alexandria? Underwater
How fast can sea level rise? A lot of policymakers in the Al Gore alarm era pooh-poohed global warming on the very nearsighted assumption that sea rise would remain constant, and therefore not a problem in our lifetimes. The reality is sea rise is accelerating. Where it was ~1.4mm average per year throughout most of the 20th century, in 2006-2015 it had more than doubled to 3.6mm per year. Assuming the current rate of acceleration holds steady, the projection is only 20cm by 2050. But I think it's naive to assume the first derivative will hold steady; I think we'll see an "acceleration of acceleration" punctuated by spurts of landbound ice sheet collapse in chunks, alongside the polar icecap collapse already in progress.
Even on a pessimistic curve, say if rise doubles from 3.6mm per year to 7.2 mm per year in 10 years, and then double again to 14.4mm/y in 5 years, double again in let;s be generous 3 years, then 2 years, then doubling again in just 1 year (2046), and after that it's more a question of "did rise double, triple, or quadruple this-year-over-last-year". In that curve, there's less than a meter cumulative rise by 2047; 1.7m by 2048; nearly 6m by 2049, 22.5m by 2050, and max rise (exceeds the 70m cumulative max) by 2051. Global coastal disaster in just a few years.
+ + + + +